ScreenLab
Early Data Preview

What distracts us online?

We monitored 10,000 hours of screen time to see
what causes & reduces online distraction

Read the report

46 Behaviors Examined

Behaviors & Tips

We searched volunteers' screen time for habits linked to distraction. Here are some quick highlights.

Music

Music and focus

Users spent 21.1% less time on distractions when listening to music. This correlation held through time of day, type of work, and type of distraction.

Night Owls vs Early Birds

Time of Day Matters

Users spent almost twice (91%) as much time distracted during their least vs most focused time of day. Aligning work with high-focus hours may reduce distracted time (intervention studies needed).

Notifications

Slack interruptions

Users spent 14.1% more time on distractions after checking business chat apps, and 5.3% more after checking email.
Recovery

Get Offline During Breaks

Users focused better when they took breaks offline. In the hour after returning, users spent 19.6% less time on distractions after an offline break vs a break spent scrolling.

Distraction

Social Media is by far the most used distraction

67.4% of distracted time was spent on social media. Video streaming was next, then chat, news, gaming, and sports sites.
1,065 Apps & Sites Analyzed

Software & Focus

The software you use may influence your focus. We compared apps and sites by distracted time.

Desktop vs Web Apps

Users focused better on desktop apps than web apps.
Overall, users spent 15% more time on distractions when using web apps vs desktop apps.
Products that ship both desktop and web versions make the cleanest comparison. The table below shows productive screen time when using desktop vs web versions of common software.
Desktop vs Web

Productive screen time when the same product is run as a desktop vs web app

Desktop app Website
Notionapp.notion.com
Desktop app:
83%
Website:
69%
ChatGPTchatgpt.com
Desktop app:
81%
Website:
73%
Asanaapp.asana.com
Desktop app:
64%
Website:
53%

Software Head-to-Heads

Some apps may be more focusing than others.
We compared distracted time across writing, coding, design, and project management apps. Where a product ships both desktop and web apps, we combined the two, weighted by tracked time.
Take results with a grain of salt. Sample sizes are small, not all apps share identical responsibilities, and correlation is not causation. As we gather more data, we hope to offer similar insights with greater confidence.
Writing

Average focus by writing app

Productive Time
1
Microsoft Word
85%
2
Notion
81%
3
Apple Pages
78%
4
Google Docs
62%
Code Editors

Average focus by coding app

Productive Time
1
Terminal
93%
2
VS Code
84%
3
Cursor
80%
4
Xcode
69%
Design

Average focus by design app

Productive Time
1
Adobe Photoshop
84%
2
Affinity Photo
76%
3
Figma
76%
4
canva.com
66%
Project Management

Average focus by project management app

Productive Time
1
Linear
73%
2
Asana
61%
3
Monday
59%
4
Jira
58%

Productivity Apps

We monitored software intended to improve focus. Here are the types that performed best.
01

Virtual Coworking

Platforms such as Caveday, Focusmate, and Flow Club match users in virtual coworking sessions. Of all focus software we tracked, virtual coworking showed the most promise: users spent 68% less time on distractions when using them.
02

Pomodoro Apps

Pomodoro apps such as Session, Flow, and Tomato 2 prompt users to focus intently for a set interval (e.g. 25 minutes) before taking a scheduled rest. Results were encouraging: when using Pomodoro apps, distracted time fell 40.5%.
03

Focus Music

Apps such as Endel, Brain.fm, and Focus.music play music designed to maximize focus. When used, volunteers spent 31% less time on distractions.
From limited data: coaching apps, single-tasking apps, screen time trackers, break reminder apps, and streak apps showed no significant reduction in distracted time. This may change as our data grows.
4,435 Activations Evaluated

Most Effective Tools

Hundreds of apps claim to reduce online distraction. We measured how well they work.

Tool Effectiveness

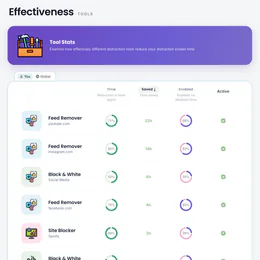
Anti-distraction tools ranked by time saved

Time reducedTime enabledTotal time saved
1
Feed RemoversStrip feeds from social media
643h
2
Grayscale ModeTurn distracting sites black & white
206h
3
Text Only ModeStrip images & video
90h
4
Site BlockersBlock distracting sites entirely
53h
5
Blue Light FiltersFade blue colors
1h

Overview

We gave volunteers access to common anti-distraction tools. Then we tracked changes in time spent on distracting platforms.

How We Measured

We tracked time spent on the 347 most-used social media, streaming, gaming, chat, news, sports, and gossip platforms when each tool was enabled vs disabled.

Why Time Enabled Matters

A primary complaint against anti-distraction tools is that they replace one form of temptation with another: the temptation to disable the tool. Ensuring users resist the urge to disable anti-distraction tools is as important as their efficacy.
To measure effectiveness, we examined both distracted time reduced and percentage of time enabled. Results below are ranked by total time saved, which considers both metrics.

About the Tools

A brief overview of the tools we tested.
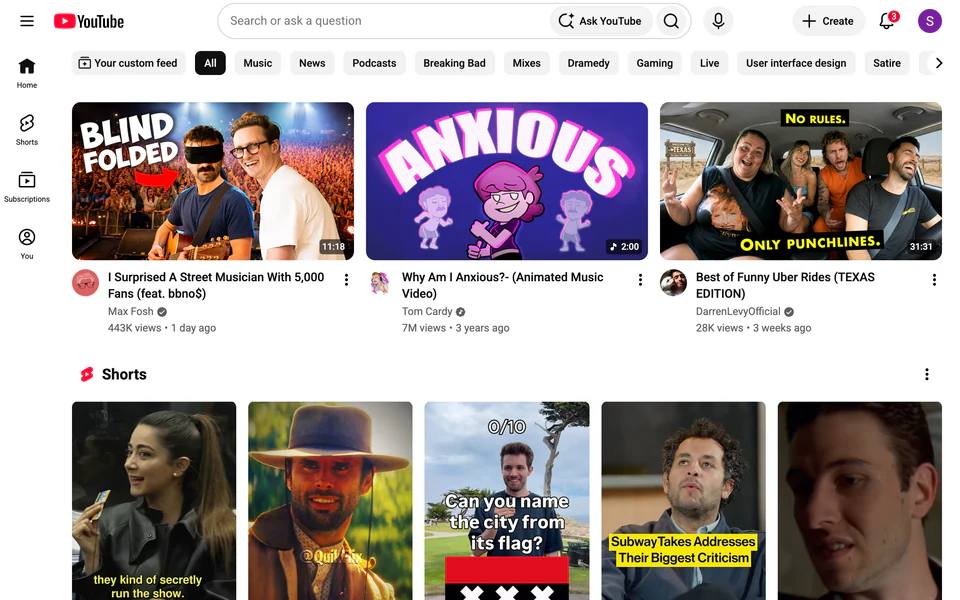
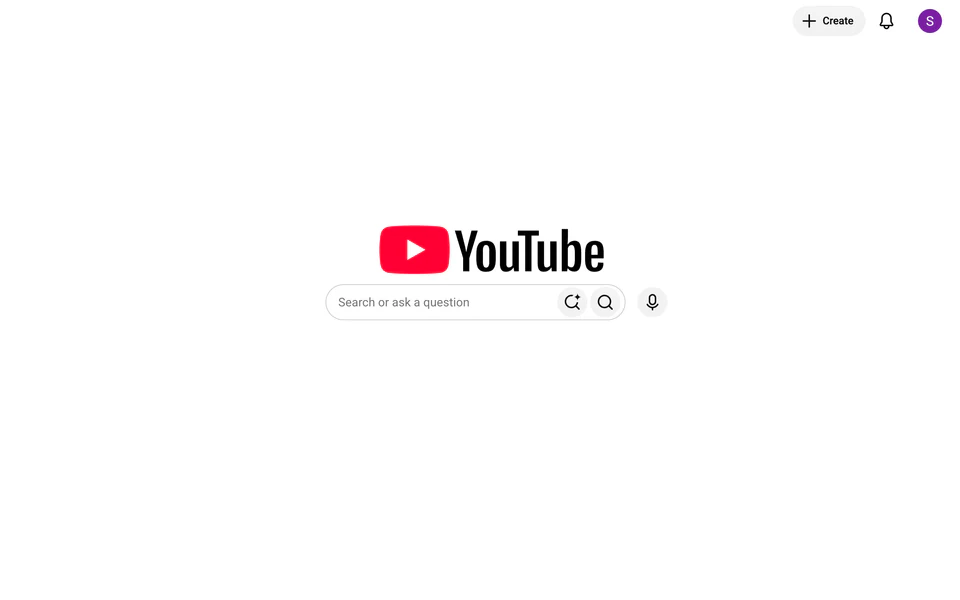
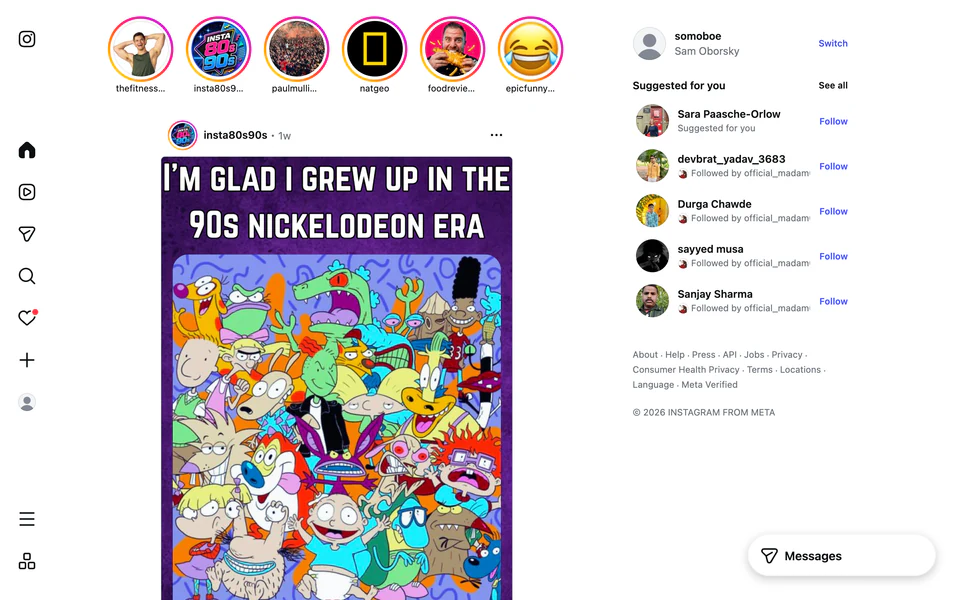
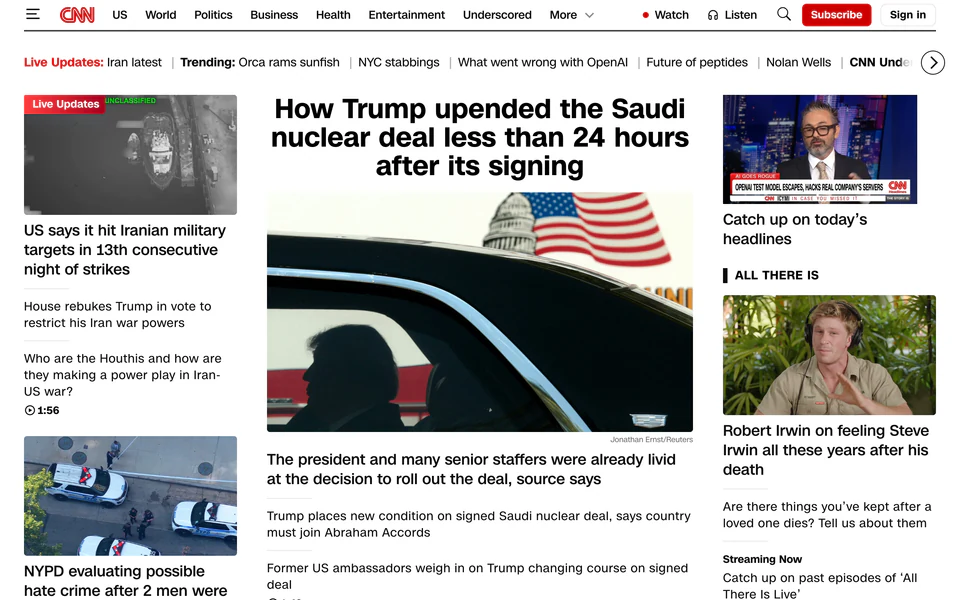
We tested five tool types: feed removers, grayscale mode, text only mode, site blockers, and blue light filters. Below are demonstrations of each tool, ranked by time saved.
youtube.com
YouTube homepage
YouTube homepage with Feed removers enabled
01

Feed removers

Time reduced
Time enabled
Time saved
Feed removers hide scrollable walls and recommended content on social media. They were by far the most effective tool we tested, saving 12.1ร— the distracted time of site blockers.
02

Grayscale mode

Time reduced
Time enabled
Time saved
Grayscale tools turn distracting sites black and white. They were surprisingly effective, largely due to substantially lower disabling rates than most solutions.
instagram.com
Instagram feed
Instagram feed with Grayscale mode enabled
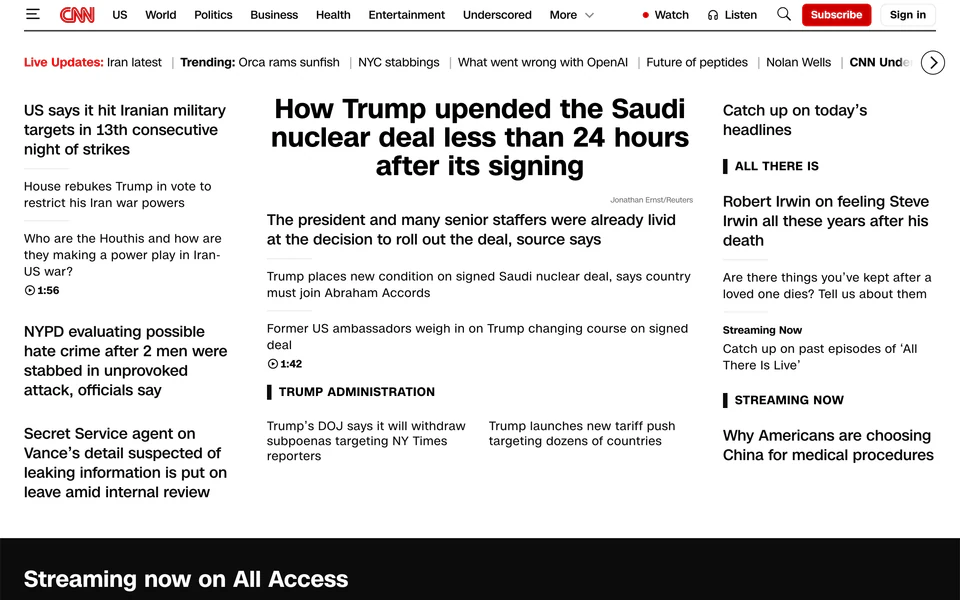
cnn.com
CNN homepage
CNN homepage with Text only mode enabled
03

Text only mode

Time reduced
Time enabled
Time saved
Text only mode strips images and videos from distracting platforms. Its impact was modest on social media due to low usage, but it showed value on news, gossip, and sports sites.
04

Site blockers

Time reduced
Time enabled
Time saved
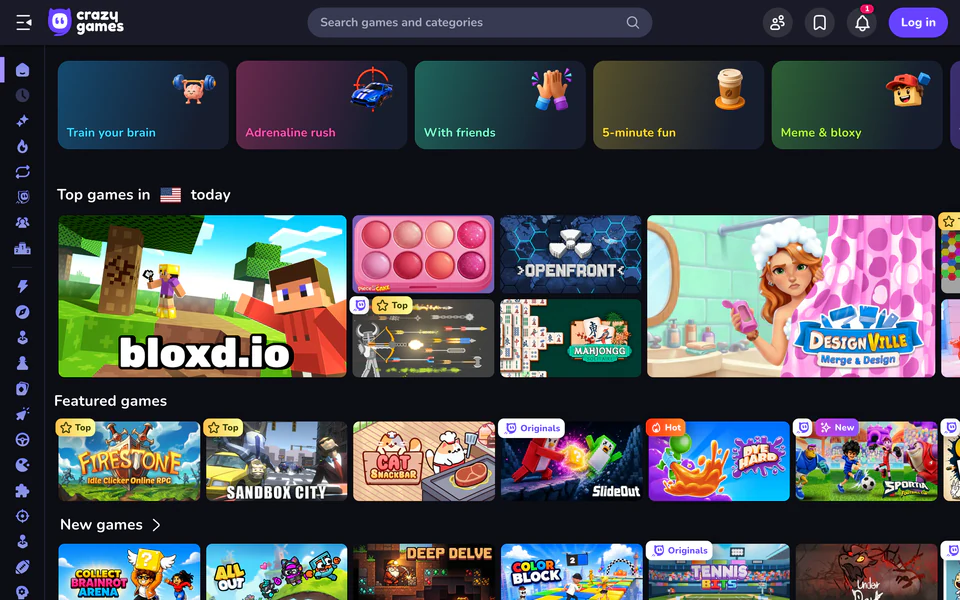
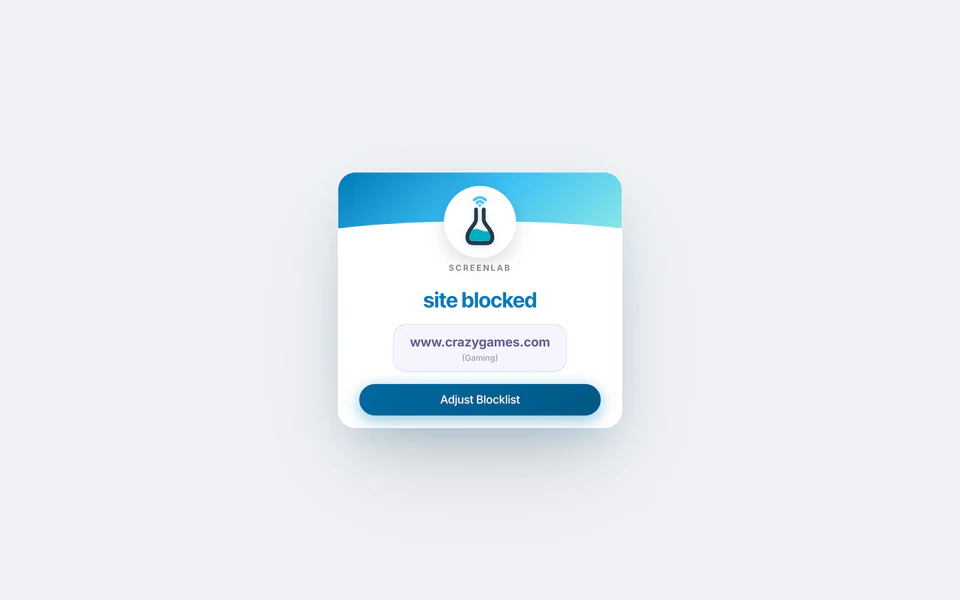
Site blockers prevent access to distracting sites entirely. Usage rates averaged 11%, leaving them second-lowest in total time saved.
crazygames.com
CrazyGames homepage
CrazyGames homepage with Site blockers enabled
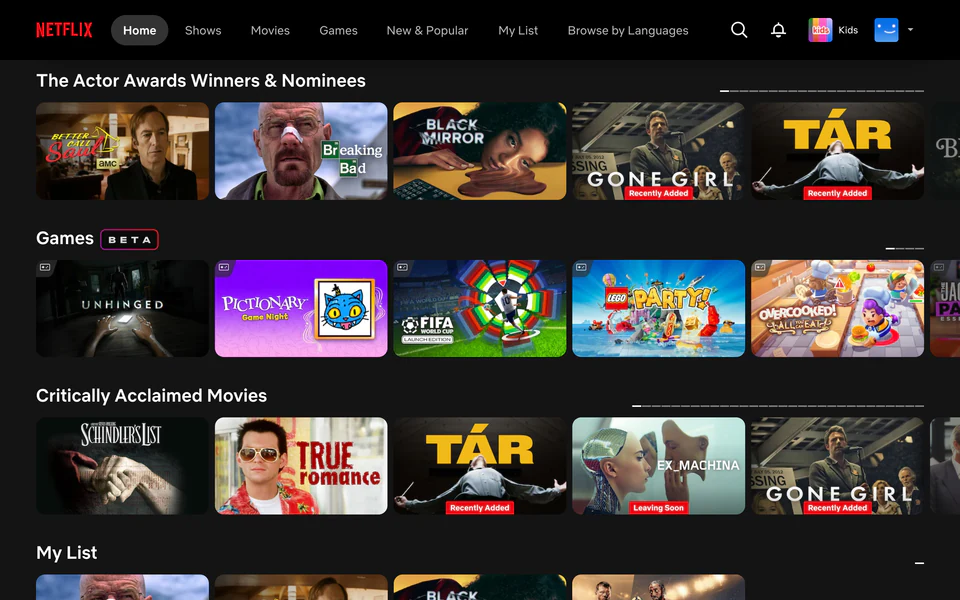
netflix.com
Netflix homepage
Netflix homepage with Blue light filters enabled
05

Blue light filters

Time reduced
Time enabled
Time saved
Blue light filters dull blue colors on distracting sites. In theory this reduces the pull of distractions, but users rarely enabled these tools and savings were modest.

The Math

Time reduced, time enabled, and how we calculate total time saved.

Time Reduced

The decrease in time spent on distracting platforms when a tool is enabled vs disabled.
Example
If a user spends 40% of their screen time on distractions when a tool is disabled, and only 20% when the tool is enabled, time reduced would be 50%.

Time Enabled

The percentage of screen time users keep each tool enabled.
Example
If a user has 100 hours of tracked screen time, and the tool is enabled for 35 of those hours, the tool's time enabled is 35%.

Total Time Saved

Time saved depends on both of the above: a tool has to cut distraction and stay enabled. For each distracting platform, we multiply the drop in its share of screen time by the hours the tool was enabled, then sum the results. Specifically:
ฮฃฯDoff,ฯSoff,ฯโˆ’Don,ฯSon,ฯร—Son,ฯ
Dtime on distracting platformStotal screen timeฯdistracting platformontool enabledofftool disabled
Example
If a user spends 20% of their screen time on Instagram, and a tool cuts that figure to 5%, and the user keeps the tool enabled for 100 hours, it saves (20% โˆ’ 5%) ร— 100 = 15 hours of distracted time on Instagram. Repeat for every platform and sum the results to get total time saved.
718 Work Apps Evaluated

Work & Procrastination

During work hours, volunteers spent 43% of their screen time on distractions. We examined links between work and focus.
Focus & Type of Work

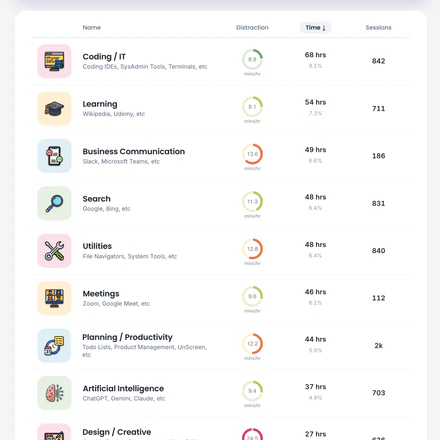
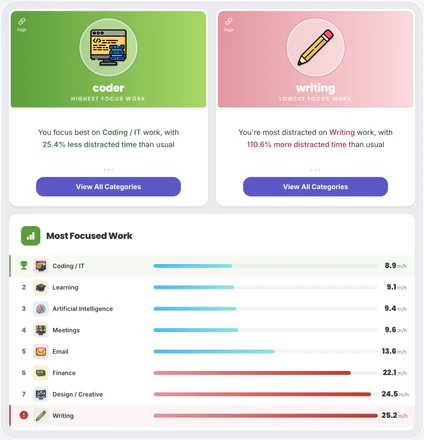
Users spent almost twice as much time distracted on their lowest vs highest-focus type of work.
Furthermore, highest-focus categories varied substantially by user. Understanding individuals' highest-focus work types and assigning tasks accordingly may reduce distracted time.
01

How we measured

We sorted the 718 most-used work apps and sites into 20 work categories and measured average distracted time across each one.
02

The Results

The average user spent 1.92ร— as much time on distractions when doing their least vs most focused type of work. For a full-time worker, that difference would amount to more than 1 workday per week of distracted time.
Minimizing work in users' lowest-focus categories may reduce distraction. Intervention studies are necessary to confirm.

Which Jobs Slack Off the Most?

For fun, we looked at distracted screen time by job. Somebody needs to report HR to HR.
(There are many confounding factors we didn't consider. Take with a grain of salt.)
Focus by Job

Distracted time by industry

Distracted mins/hr
1
HR
32.1
2
Finance
19.8
3
Education
18.3
4
Writing
15.2
5
Coding
14.6
6
Design / Creative
14.0
7
Artificial Intelligence*
12.6

* The Artificial Intelligence category does not distinguish between productive/unproductive AI use. Its distracted time may be underreported.

About The Data

Methodology

How we collect, organize, and analyze the data behind this study.
How We Do It

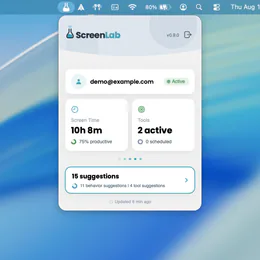
ScreenLab combines a desktop app to track screen time, a browser extension to disable distractions online, and a web platform to analyze and present data. Here's how they work together.

Tracking the Data

Volunteers install a desktop app that tracks which app or website is frontmost on their machine.

Categorizing the Data

We sort the 1,065 most-used apps and websites into 35 categories, each classified as productive (e.g. business, creative, learning) or unproductive (e.g. social media, streaming, gaming).

Analyzing the Data

We use a variety of algorithms to find correlations between screen habits, tools, and distracted screen time.

Providing the Tools

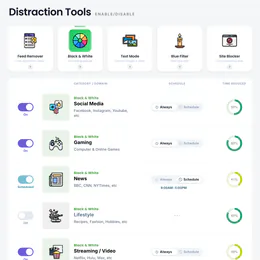
We also provide access to common anti-distraction tools through a browser extension.

Analyzing the Tools

We track when volunteers enable and disable each tool, and how their screen habits differ between enabled and disabled periods.

Volunteer Your Screen Time

We need more data. If you're on Mac, join the study.

Currently Mac Only

You seem to be using an unknown OS. The full app is currently Mac only.

In the meantime, you're welcome to use ScreenLab Lite. It's free, no signup required, and provides access to our anti-distraction tools (but without the analytics).

01

10,000 hours is not enough

The insights above come from 10,000 hours of volunteer screen time. We want a million hours.
02

Help us collect data

If you're on Mac, you can help. Install ScreenLab and let it measure your screen time. Your activity isn't sold or shared with anyone.
03

What you get

Besides helping us, you'll get personalized insights into your own distraction, access to every anti-distraction tool we test, and data on what works best for you.